Showing posts with label Statistics. Show all posts

19 December 2016

Gender Gap, 2004-2014 #nlpoli

In 2004,  the median income for men in Newfoundland and Labrador was $10,000 higher than the median income for women.  By 2014,  the gap in median income between men and women in Newfoundland and Labrador had grown to $16, 130.

The median income for women had grown $8,810 between 2004 and 2014.  But the median income for men grew by $14,940.

That's a pretty chart showing the median income in Newfoundland and Labrador for the period 2004 to 2014.  The data is from CANSIM 111-0008.

Turquiose line = men.  Red line = women.  Orange is the median income for both sexes.

-srbp-

20 July 2015

Maternal mortality #nlpoli

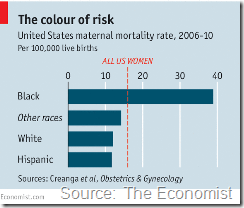
Black women in the United States are twice as likely to die as a result of complications of pregnancy and childbirth as are white and Hispanic Americans, according to new research.  The story turned up in The Economist over the weekend.

colour of risk - economistBetween 2006 and 2010,  the death rate for black women was almost 40 per 100,000 deliveries compared with just over 10 for Hispanics and whites. 

But there’s more.

The United States is one of only eight countries globally to see its maternal mortality rate head up in decade 2003 to 2013..”American women are now more than three times as likely to die from pregnancy-related complications as their counterparts in Britain, the Czech Republic, Germany or Japan,”  according to The Economist.. The overall American rate of maternal death is 18.5 for every 100,000 live births.

24 July 2014

Crime Severity Indices, St. John’s #nlpoli

This week, Statistics Canada released their latest compilation of crime statistics based on reports by police.

The figures in the release were year to year but if you hunt around a bit,  you can find the original tables of data.  from there, you can pluck out specific information.  In this post, we’ve pulled out the data for St. John’s from 2003 to 2013.

03 August 2011

By the numbers – infectious syphilis rates

Inspired by a comparison of rates for infectious syphilis for Canada and for Alberta, your humble e-scribbler took a gawk at the tables from the Public Health Agency of Canada that the Globe staff used to make their tables.

Alberta’s rate per 100,000 of population in 2009 was 7.3 compared to 5.0 for Canada.

The Newfoundland and Labrador rate was 0.6 per 100,000 and that hardly looks like anything at all.

But take a look at the rates for males and you see something dramatically different.

From 1999 to 2007, the male rate was typically 0.0, as in nil, nada and zippo.  In 2003, it hit zero point three, in 2005 it was zero point eight and in 2007 the rate hit zero point four.

But…

In 2008, the rate for syphilis infection among males in Newfoundland and Labrador hit 2.4 per 100,000.  It was 1.2 per 100K in 2009.

The rates for males in Alberta was 7.8 and 9.8,  up from 8.7 and 9.8 the two preceding years.

That’s one phantasmagorical change – even if the absolute numbers are relatively small.  But if you stop and think about it for a second, you can see what might have been going on.  Alberta’s big jump was in 2003 when the rate hit 2.0 up from zero point six.

Migrant labour to and from Alberta likely caused the rate to jump in Newfoundland and Labrador.

And there’s no way of knowing for sure how many of those Alberta syph cases actually belong to people who list their residence for income tax purposes as being in Newfoundland and Labrador.

Syphilis can be a nasty disease.  In the days before penicillin, people died from it, most often because the disease progressed to a deadly stage before people realised what they’d contracted.

Odds are good, though, that people with a sore or two aren’t avoiding their doctors these days.  Syph is readily treatable. If people get it, they need a trip to the doctor and a few pills. Modern medicine coupled with drug insurance plans and Medicare mean that no one has to suffer along in quiet.

And if the doctors get the cases, then they are required by provincial laws to report the diseases to their provincial public health officers.

- srbp -

10 March 2011

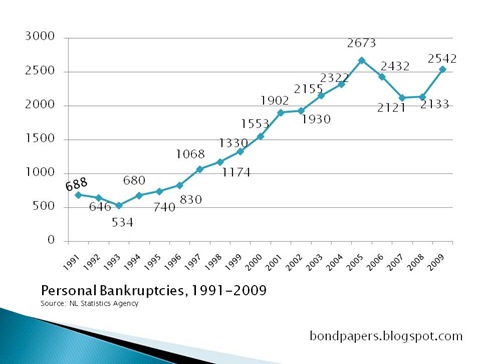
Personal Bankruptcies in Newfoundland and Labrador

The following chart shows personal bankruptcies in Newfoundland and Labrador from 1991 to 2009.

Data is from Statistics Canada, compiled by the Newfoundland and Labrador Statistics Agency.

personal bankruptcies

- srbp -

24 March 2010

Stat Porn – all outlinks are local

On any given day, people who read Bond Papers also like to read:

  1. John Gushue’s  dot dot dot.
  2. Geoff Meeker’s Meeker on media
  3. Ryan Snodden’s weather blog
  4. Russell Wangersky
  5. Bob Wakeham

All the number of visits to the other regular links around these parts  - over there on the left - fall off dramatically after those.

Well at least that’s what Statcounter tells us.

-srbp-

09 April 2007

Headin' down the road, 2007 version

Greg Locke has been blogging his move to Alberta.

Find the latest entry here, which morphs quickly into a discussion about the high percentage of people leaving the province who hold university degrees and other specialized training. The chart, above, is from a slide presentation done in the mid 1990s. Note that university degree-holders have consistently been the largest proportion of migrants from Newfoundland and Labrador since the mid 1970s at least.

The slide was originally presented in this post on outmigration.

How much is enough?

1. Government of Newfoundland and Labrador, own source revenue, 1992: $1.7 billion
Government of Newfoundland and Labrador, own source revenue, 2006: $3.2 billion

2. Government of Canada transfers to Gov NL, 1992: $1.4 billion
Government of Canada transfers to Gov NL, 2006: $1.5 billion

3. Government of Newfoundland and Labrador, per capita expenditure, 1992: $5574
Government of Newfoundland and Labrador, per capita expenditure, 2006: $8675

Note: Population, 1991: 574,000
Population, 2006: 509,000